
TL;DR: Actual vs. theoretical food cost (AvT) compares what your recipes say a period should have cost against what you actually spent on food. A variance under 2 percentage points is healthy control; above 4 to 5 points usually means theft, waste, over-portioning, or stale recipe costs. Run AvT weekly by category, not just monthly at the P&L level, and investigate in this order: recipe mapping, receiving, then portions.
Most restaurants watch their food cost percentage every month and call it done. That number alone hides the real problem. Actual vs. theoretical food cost, or AvT, is the analysis that actually tells you why food cost moved and where the money went. It compares what your recipes say a period should have cost against what you truly spent, based on purchases and inventory.
The gap between those two numbers is your variance. A small, consistent variance under 2 percentage points is normal and reflects trim loss, cooking yield, and small human error. A variance of 4 to 5 points or more, especially if it repeats month after month, is not noise. It is theft, waste, over-portioning, or a recipe database that no longer matches what invoices actually cost.
This guide covers what AvT is, how to calculate both sides of it, what causes the gap, realistic benchmarks by concept, and how often to run the analysis so it actually catches problems instead of just reporting them after the damage is done.
What Is Actual vs. Theoretical Food Cost?
Actual vs. theoretical food cost is the comparison between what your food should have cost based on recipes and sales, and what you actually spent based on purchases and inventory counts. The gap between the two numbers, called variance, tells you whether your kitchen is running under control or leaking money somewhere you can’t see from the P&L alone.
Theoretical food cost assumes zero waste, perfect portions, and no shrinkage, every ingredient used exactly as the recipe specifies. Actual food cost captures the real world: spoilage, over-portioning, comps, spills, and anything else that happens between the walk-in and the plate. No kitchen hits theoretical cost exactly. The question AvT answers is how far off you are, and whether that distance is normal or a warning sign.
A flat food cost percentage on its own can’t tell you this. Two restaurants can both run 32% food cost, one because its recipes are dialed in and its team is disciplined, the other because high menu prices are masking a portion-control problem that’s quietly costing thousands a month. AvT is what surfaces the second restaurant’s problem before it shows up as a bad quarter.
Calculating Theoretical vs. Actual Food Cost
Theoretical food cost comes from your recipes and sales mix. Actual food cost comes from beginning inventory plus purchases, minus ending inventory. You need both numbers, calculated the same way every period, before a variance comparison means anything.
Theoretical food cost is built from recipes, not from what you actually bought. For every item sold in a period, multiply the recipe’s ingredient quantities by current ingredient costs, then multiply that plate cost by units sold. Add up every item and you get what your food cost should have been if every recipe was followed exactly.
The building block is recipe costing. Start with edible portion (EP) cost, which accounts for trim and cooking loss: EP cost equals the as-purchased (AP) cost divided by the yield percentage. A $4.50 per pound chicken breast that yields 85% after trimming has an EP cost of $5.29 per pound. Multiply each ingredient’s EP cost by the quantity the recipe calls for, add up every ingredient, then divide the total recipe cost by the number of portions it yields to get cost per plate.
Run that plate cost against your point-of-sale mix, the actual count of every item sold that period, and you get theoretical usage and theoretical cost for the whole period. This only works if two things are true: your recipes are accurate and current, and every menu item in your POS is correctly mapped to the right recipe. If a burger rings up as a generic “sandwich” category instead of its own costed recipe, your theoretical number is fiction before you even start comparing it to actuals. Fixing that item-level mapping in the accounting or inventory system is foundational operations work, and it’s usually the first thing worth auditing before you trust any AvT report.
Actual food cost is beginning inventory plus purchases, minus ending inventory, for the period you’re measuring. It reflects everything that physically left your storage and walk-ins, whether it went onto a plate, into the trash, or out the back door. The formula is straightforward: Actual Cost equals Beginning Inventory plus Purchases (net of credits and returns) minus Ending Inventory. This means your ending inventory count has to be accurate, or the whole number is wrong. A sloppy count, a missed invoice, an uncounted transfer between locations, or a unit mismatch (cases counted as eaches) will all distort actual cost and make your variance meaningless before you even compare it to theoretical.
This is also why stock counts matter operationally, not just for the balance sheet. A full count once a month, with weekly cycle counts on your top-value categories like proteins, dairy, and liquor, keeps actual cost close to reality without requiring a full count every week.
How Do You Calculate the AvT Variance?
Food cost variance in dollars equals actual cost minus theoretical cost for the same period. Convert it to a percentage by dividing the variance dollars by total food sales for that period, then multiplying by 100. This variance percentage is the number you track over time and compare against your benchmark.
For example, if theoretical cost for the week was $18,000 and actual cost came in at $19,800, your variance is $1,800, or about 3.6% of a hypothetical $50,000 in food sales. Every point of variance on $1 million in annual sales is roughly $10,000 in unexplained cost, so a 3.6-point gap at that volume is a real, recurring drag on profit, not rounding error.
Run this by category (proteins, produce, dairy, liquor) rather than only at the total food cost level. A healthy overall number can still hide one category, usually liquor or a high-theft protein, running way out of line. Category-level AvT is what tells you where to actually look.
Common Causes of the Actual vs. Theoretical Gap
The most common causes of AvT variance are over-portioning, unlogged waste, employee theft, stale recipe costs, and receiving or invoice errors. Most restaurants have more than one of these running at the same time, which is why the investigation order matters as much as the calculation.
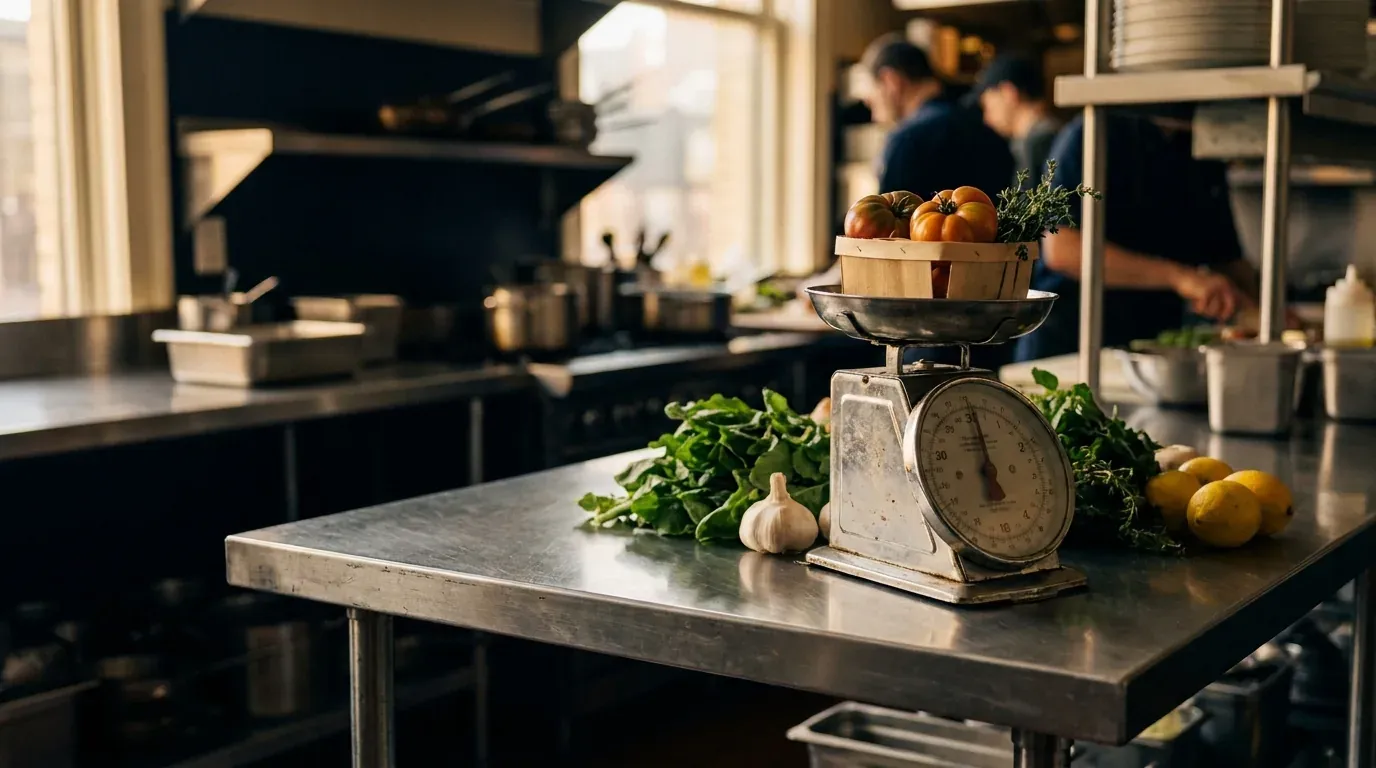
Over-portioning is usually the biggest and most fixable driver. A line cook adding an extra half-ounce of protein per plate across 200 covers a day adds up fast, and it happens without anyone deciding to steal or waste anything. Scales, portion tools, and standardized recipes fix this faster than almost anything else on this list.
Unlogged waste and spoilage create a blind spot because the ingredient left inventory but was never sold. If a case of produce spoils and nobody logs it as waste, your system thinks it should still be there, which shows up later as unexplained shrink. Food waste alone typically runs 4 to 10% of purchases when it isn’t tracked and addressed.
Theft ranges from a bartender pouring free drinks for friends to staff walking out with product. Internal theft accounts for a large share of inventory shrinkage industry-wide, and it disproportionately hits high-value items like liquor, seafood, and premium cuts, which is exactly why category-level AvT matters more than a single blended number.
Stale recipe costs are the quiet one. If your recipe database still reflects last year’s invoice prices, your theoretical cost is wrong even though nothing changed operationally. One operator found this was the primary driver of a persistent gap after recipe costs hadn’t been refreshed in six months. Repricing recipes against current invoices every 30 to 90 days keeps theoretical cost honest.
Receiving and invoice errors, comps, and voids that never get logged against the right category round out the list. Every one of these pushes actual cost up (or theoretical cost down) without a corresponding operational change, so they all look identical on a P&L until you dig into the variance.
Realistic AvT Variance Benchmarks
A healthy AvT variance is under 2 percentage points for most concepts. A gap of 2 to 4 points deserves a closer look, and anything sustained above 4 to 5 points is a systemic problem, not noise, and needs an immediate root-cause investigation.
Best-in-class operators run variance around 1% or less, which reflects tight portion control, disciplined receiving, and recipe costs that stay current. QSR and fast-casual concepts, with simpler menus and more standardized portions, tend to run tighter than full-service and fine dining, where hand-portioned proteins and made-to-order prep introduce more natural variation.
Bar and liquor programs deserve their own benchmark. Pour variance in bar and nightlife operations often runs higher than food variance because free pours, comped drinks, and high-value bottles are easier to lose track of than a plated protein. Track liquor AvT separately from food AvT; blending the two hides exactly the category most likely to be leaking.
Don’t treat 0% variance as the goal. A little variance is expected from trim loss and normal kitchen friction. The goal is a small, stable number that doesn’t drift upward month over month, not a perfect match that would actually suggest someone is manipulating the count.
How Often Should Restaurants Run AvT Analysis?
Run AvT weekly for your top categories, with a full reconciliation monthly. Weekly tracking catches problems roughly three times faster than waiting for a monthly report, because a small weekly gap is easy to trace to a specific shift or vendor delivery, while a monthly gap could have six weeks of causes tangled together by the time you see it.
A practical cadence looks like this: weekly cycle counts and category-level AvT on proteins, dairy, and liquor, since those categories carry the most cost and the most theft risk. Pair that with a full physical count and full AvT reconciliation once a month across every category. If your operation is unusually stable, consistent menu, secure storage, locked-in recipes, monthly-only can work, but that’s the exception, not the default, for most independent and multi-unit operators.
When you find a category running hot, the investigation order matters. Start with POS item mapping and recipe accuracy, since a mapping error will fake a variance that has nothing to do with the kitchen. Then check receiving and invoices for price creep or short deliveries. Only then look at portions, waste logs, and theft, since those are the hardest and most sensitive causes to confirm.
Where FORCS Fits In
AvT is exactly the kind of analysis that falls through the cracks between a bookkeeper who closes your books and a chef who runs the line. It requires accurate item-level mapping in your accounting or inventory software, current recipe costs, and disciplined stock counts, all done consistently, every week, not just when something feels off.
This is the core of what FORCS operations support does: recipe creation and costing, item-level mapping in your accounting system, weekly stock counts, and the AvT and COGS analysis that turns a blended food cost number into a real answer for where the money is going. If your food cost percentage looks fine but you still can’t explain why margin keeps slipping, AvT is usually where the answer is hiding.
Book a consultation and we’ll walk through what a weekly AvT report would look like for your concept, and what it would likely surface in the first 30 days.
Frequently Asked Questions
What is a good actual vs. theoretical food cost variance? Under 2 percentage points is healthy for most restaurant concepts. A gap of 2 to 4 points is worth investigating, and anything above 4 to 5 points sustained over several weeks usually points to a real problem like theft, waste, or stale recipe costs, not normal kitchen variation.
What’s the difference between food cost percentage and AvT variance? Food cost percentage is a single number: cost of goods sold divided by sales. AvT variance compares that actual number to what your recipes say it should have been. A restaurant can have a fine-looking food cost percentage and still have a large AvT variance hiding inside it.
Can AvT variance ever be negative? Yes. A negative variance means actual cost came in lower than theoretical, which can happen from underportioning, a recipe that overstates true cost, or unusually favorable invoice pricing that week. It’s worth investigating too, since underportioning eventually shows up as guest complaints even though it looks good on the cost report.
Do I need special software to run AvT analysis? No, though it’s faster with it. You can calculate AvT with accurate recipes, a POS sales mix report, and disciplined inventory counts in a spreadsheet. Software like Restaurant365 or similar platforms automate the pull from POS and inventory, which matters more as you add locations or SKUs, but the underlying math is the same either way.
Which category should I check first when AvT variance is high? Start with your highest-cost, highest-theft-risk categories: proteins and liquor. These carry the most dollar value per unit and the most incentive for theft or over-portioning, so they usually explain the largest share of a variance before you need to dig into lower-value categories like dry goods.